A partial view of a website header with the words 'DASHBOARDS' in uppercase and 'built for the people who act on them' in italics.
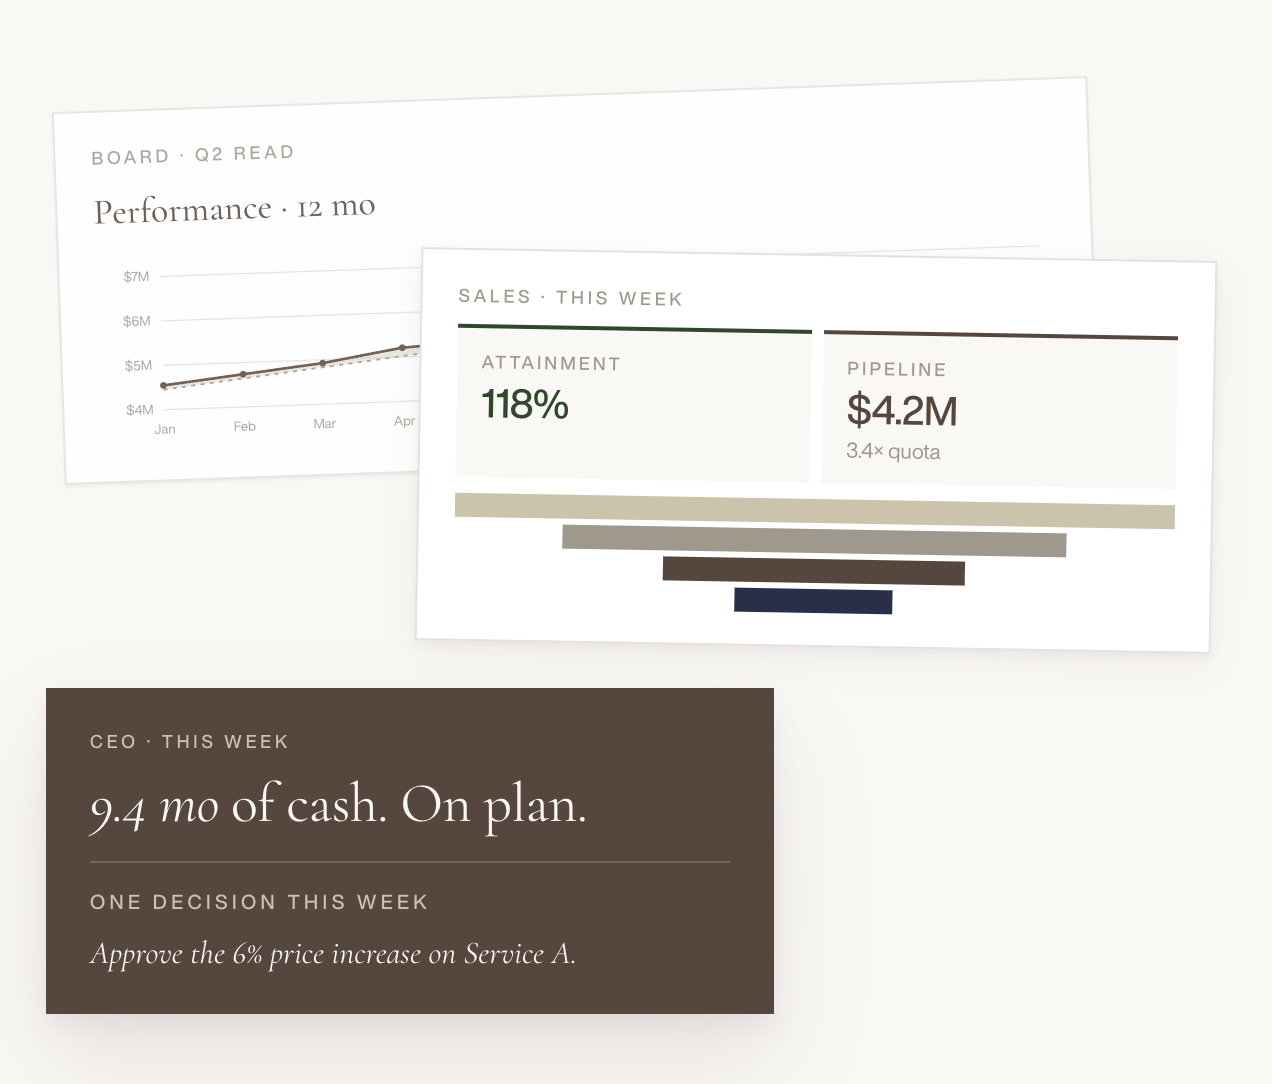
Business presentation slides showing sales performance, attainment at 118%, pipeline value at $4.2 million with 3.4 times quota, CEO report on cash flow with $9.4 million on plan, and a performance trend chart from January to April.

Your numbers in plain view.

The metrics that matter, in front of the right person, at a glance, in real time.

No digging through reports. No piecing critical data together. Just a clear line of sight to whether things are on track — and an early warning when they're not.

ONE BUSINESS, MANY POINTS OF VIEW

Same company.

Four different views.

The CEO and the department head are running the same company — but they don't need to see the same numbers. We design dashboards tuned to each level of responsibility, so everyone gets the view that helps them make better decisions in their own role.

01

LEADERSHIP / CEO

The whole business at a glance.

Cash position, revenue against plan, profitability, the budget-to-actuals trend, and the two or three signals that tell you whether the strategy is actually working.
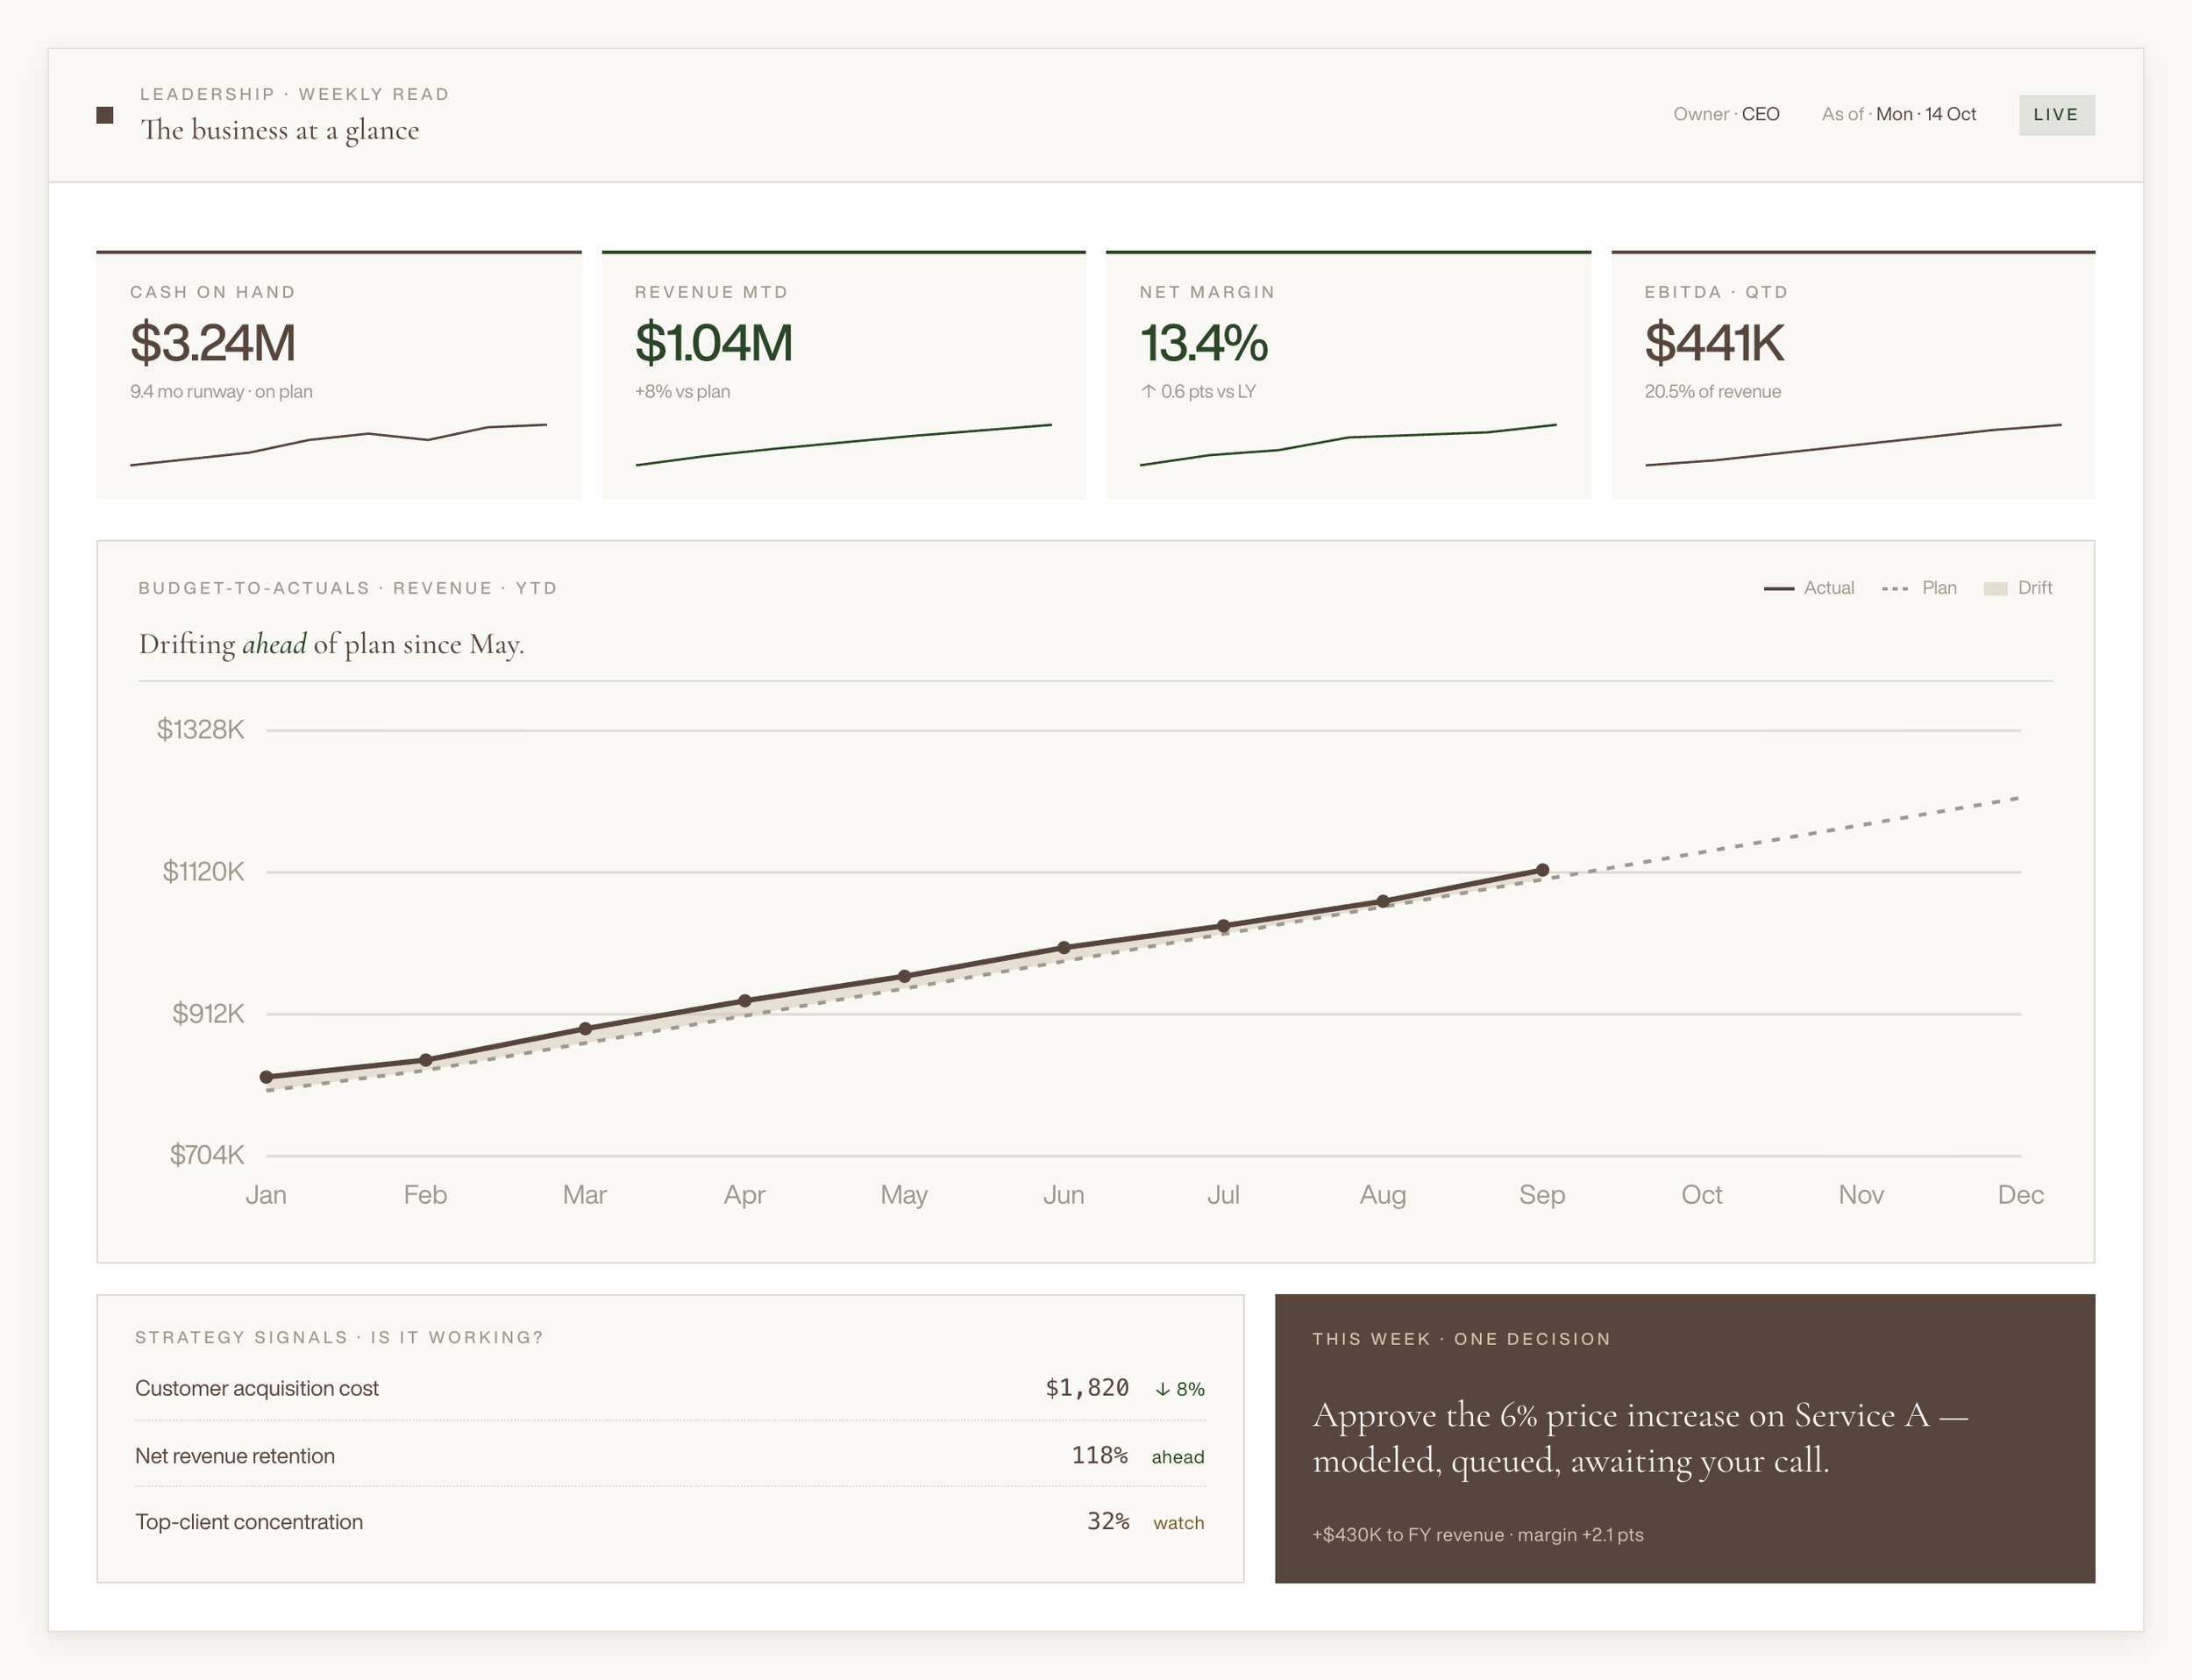
ceo-dashboard

02

BOARD, INVESTORS & ADVISORS

The clean, credible view for the people you answer to.

Cash runway, performance against budget over time, and the metrics that matter to capital — presented so they can read them in a minute, not an hour.
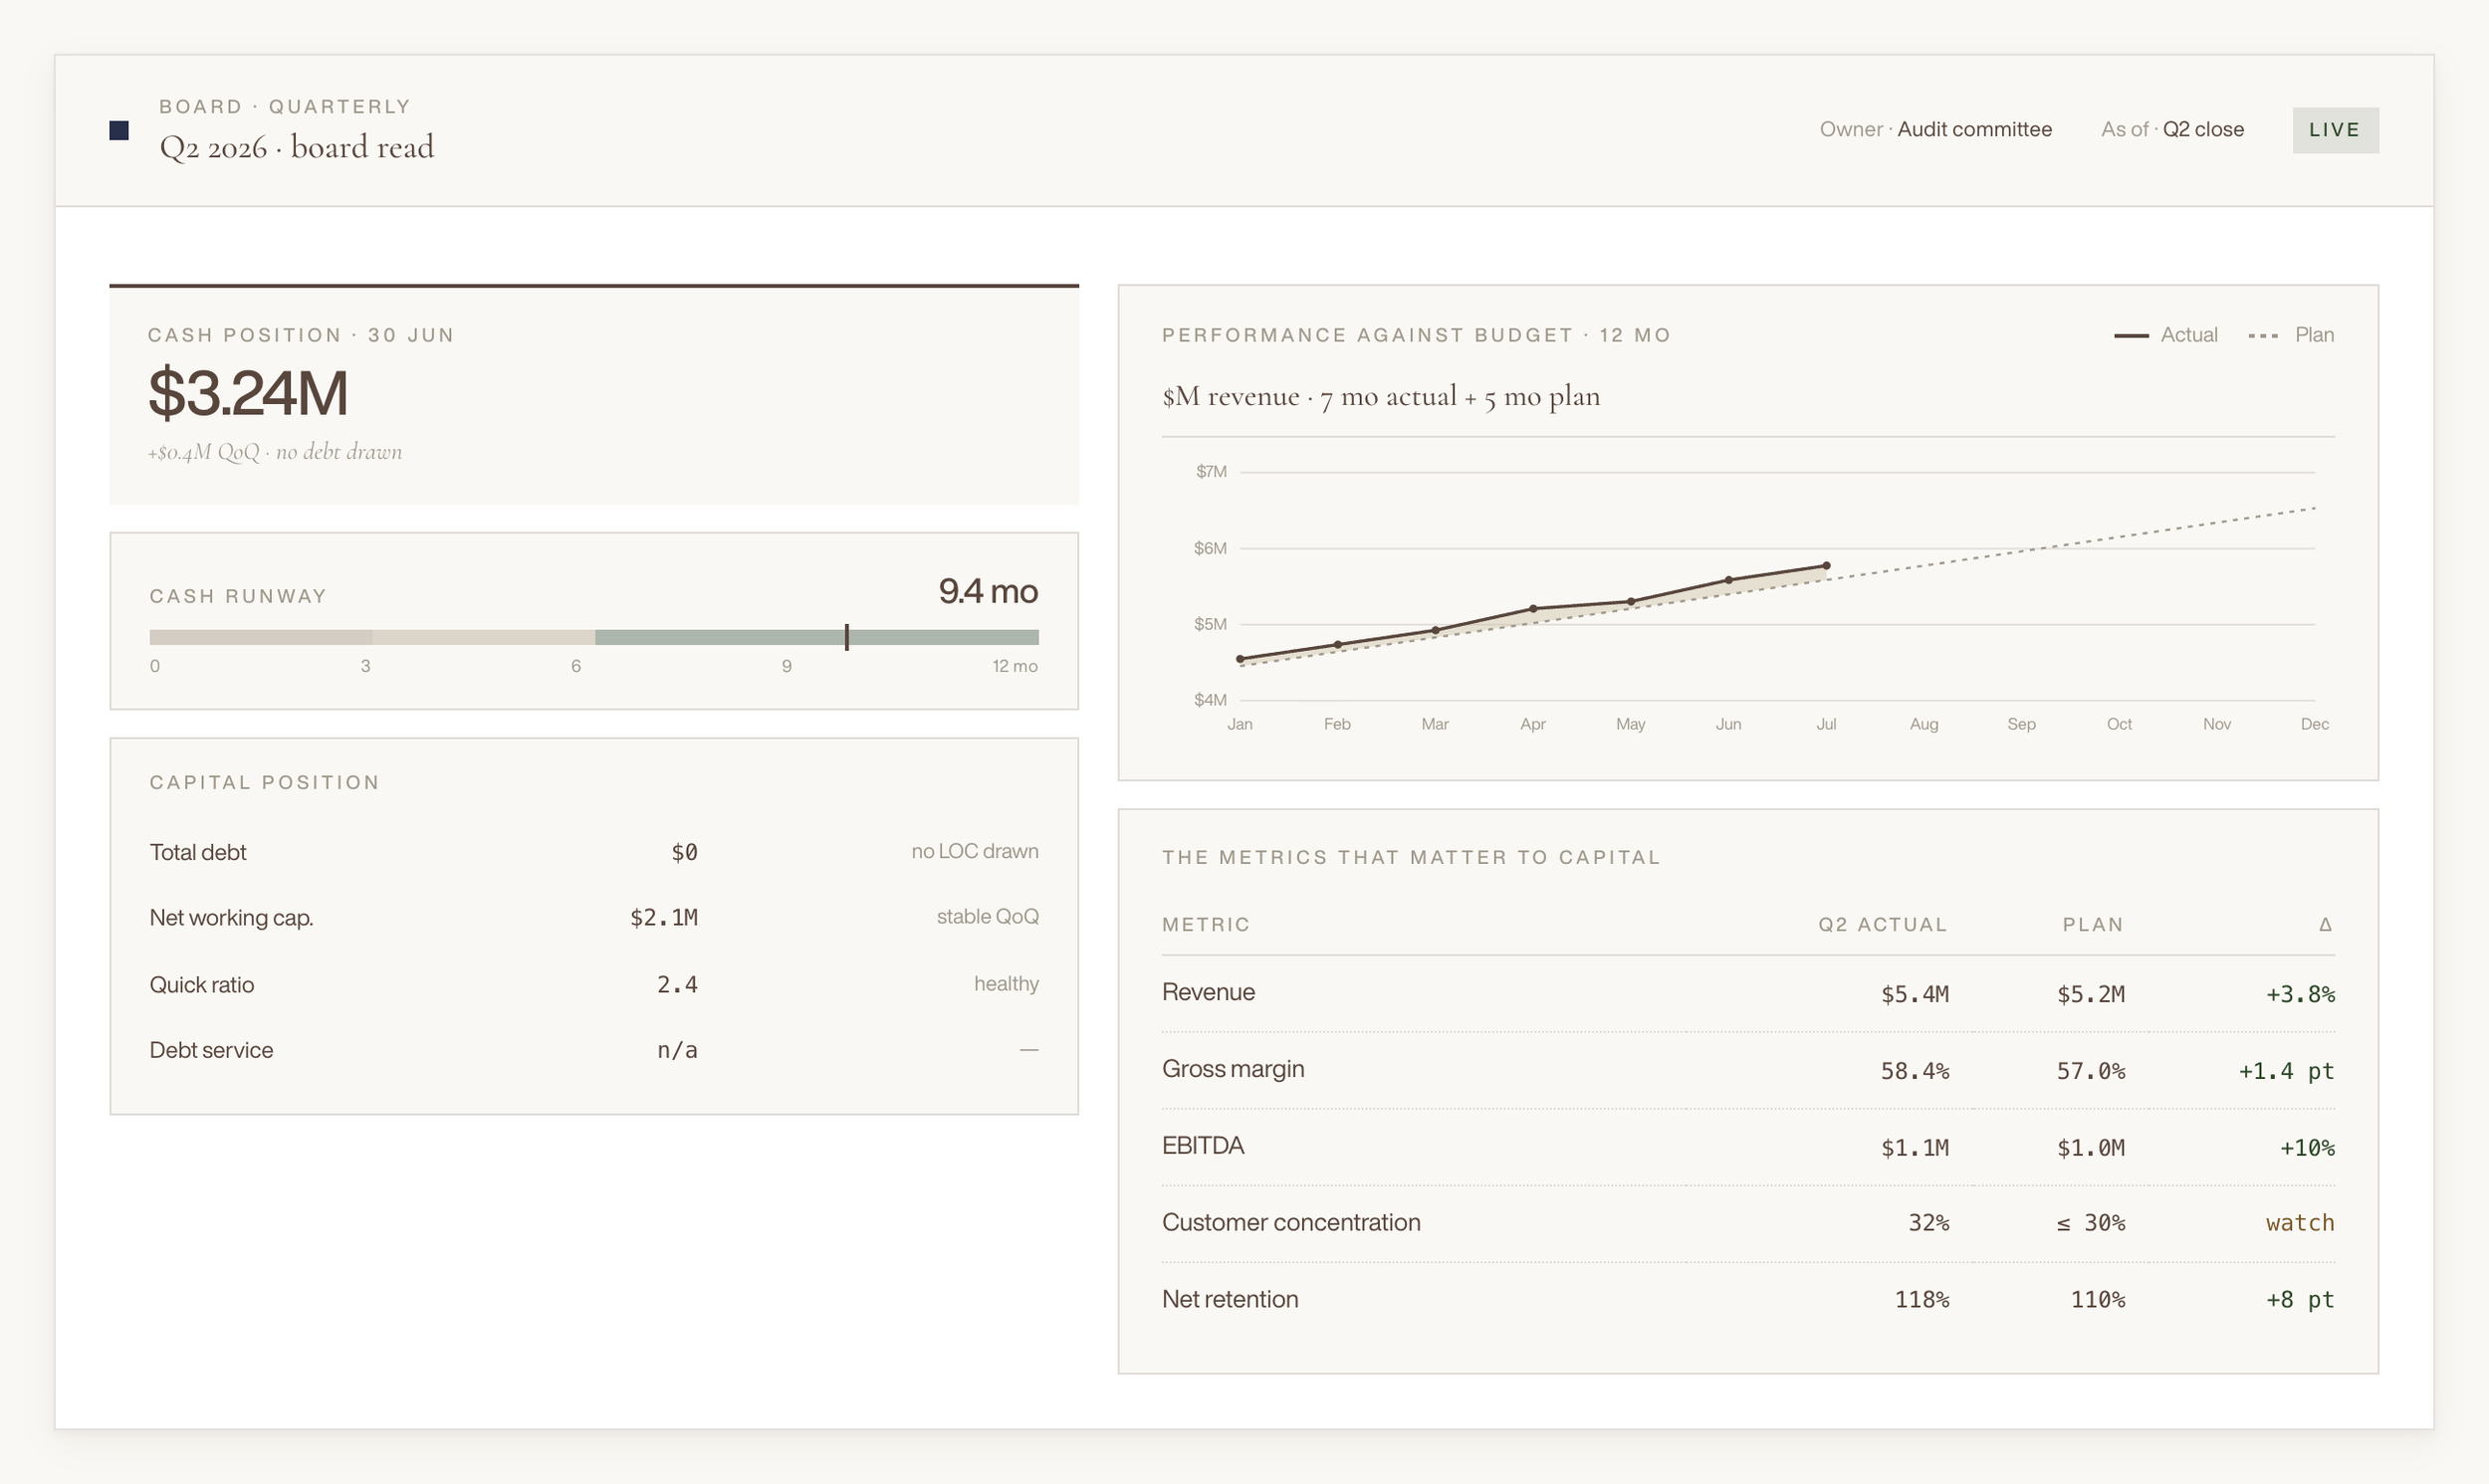
A digital dashboard displaying company financials for Q2 2026, including cash position of $3.24 million, cash runway of 9.4 months, and performance metrics such as revenue, gross margin, EBITDA, customer concentration, and net retention, with graphs and charts illustrating financial trends.

03

DEPARTMENT HEADS

The numbers each leader actually owns.

Sales sees pipeline and conversion. Operations sees throughput and cost. Each function gets the metrics that drive their piece of the business — with their slice of cash impact and budget-to-actuals trend front and center.
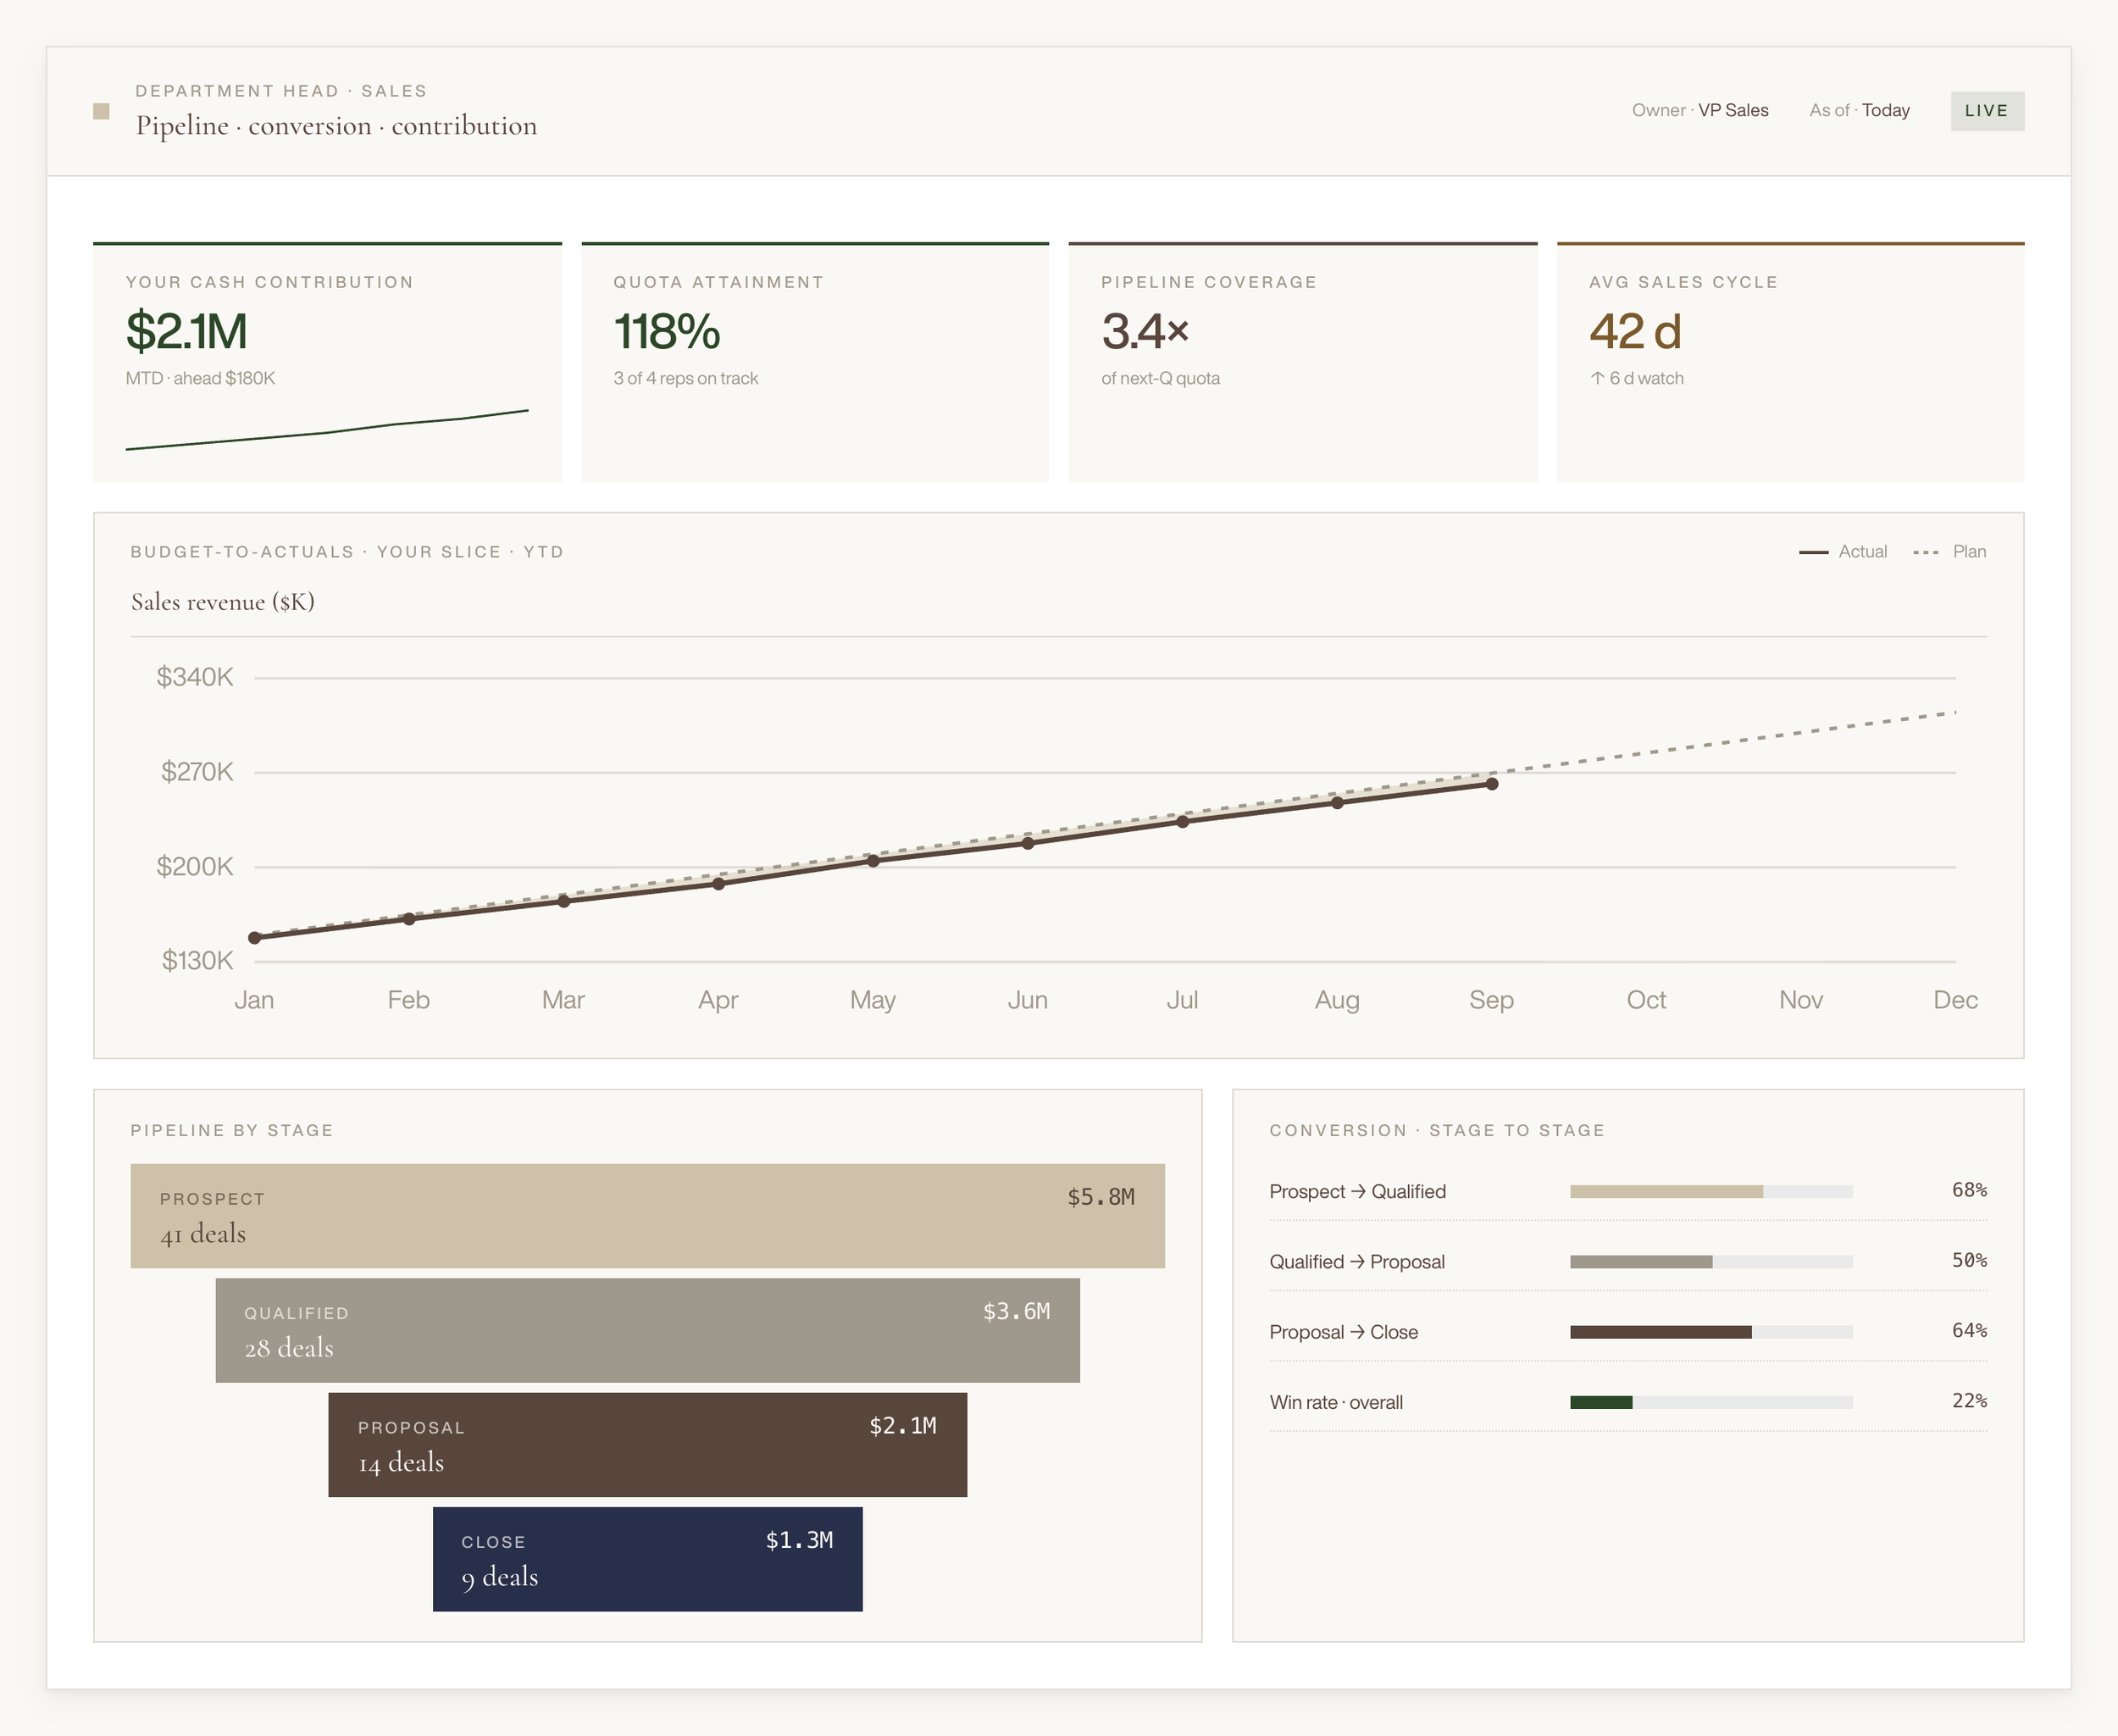
Business dashboard with metrics, charts, and sales pipeline stages in neutral tones.

04

FINANCE LEAD / CONTROLLER

The working view.

Cash flow detail, the budget-to-actuals trend line broken out by line item, and the operational drivers behind the headline numbers.
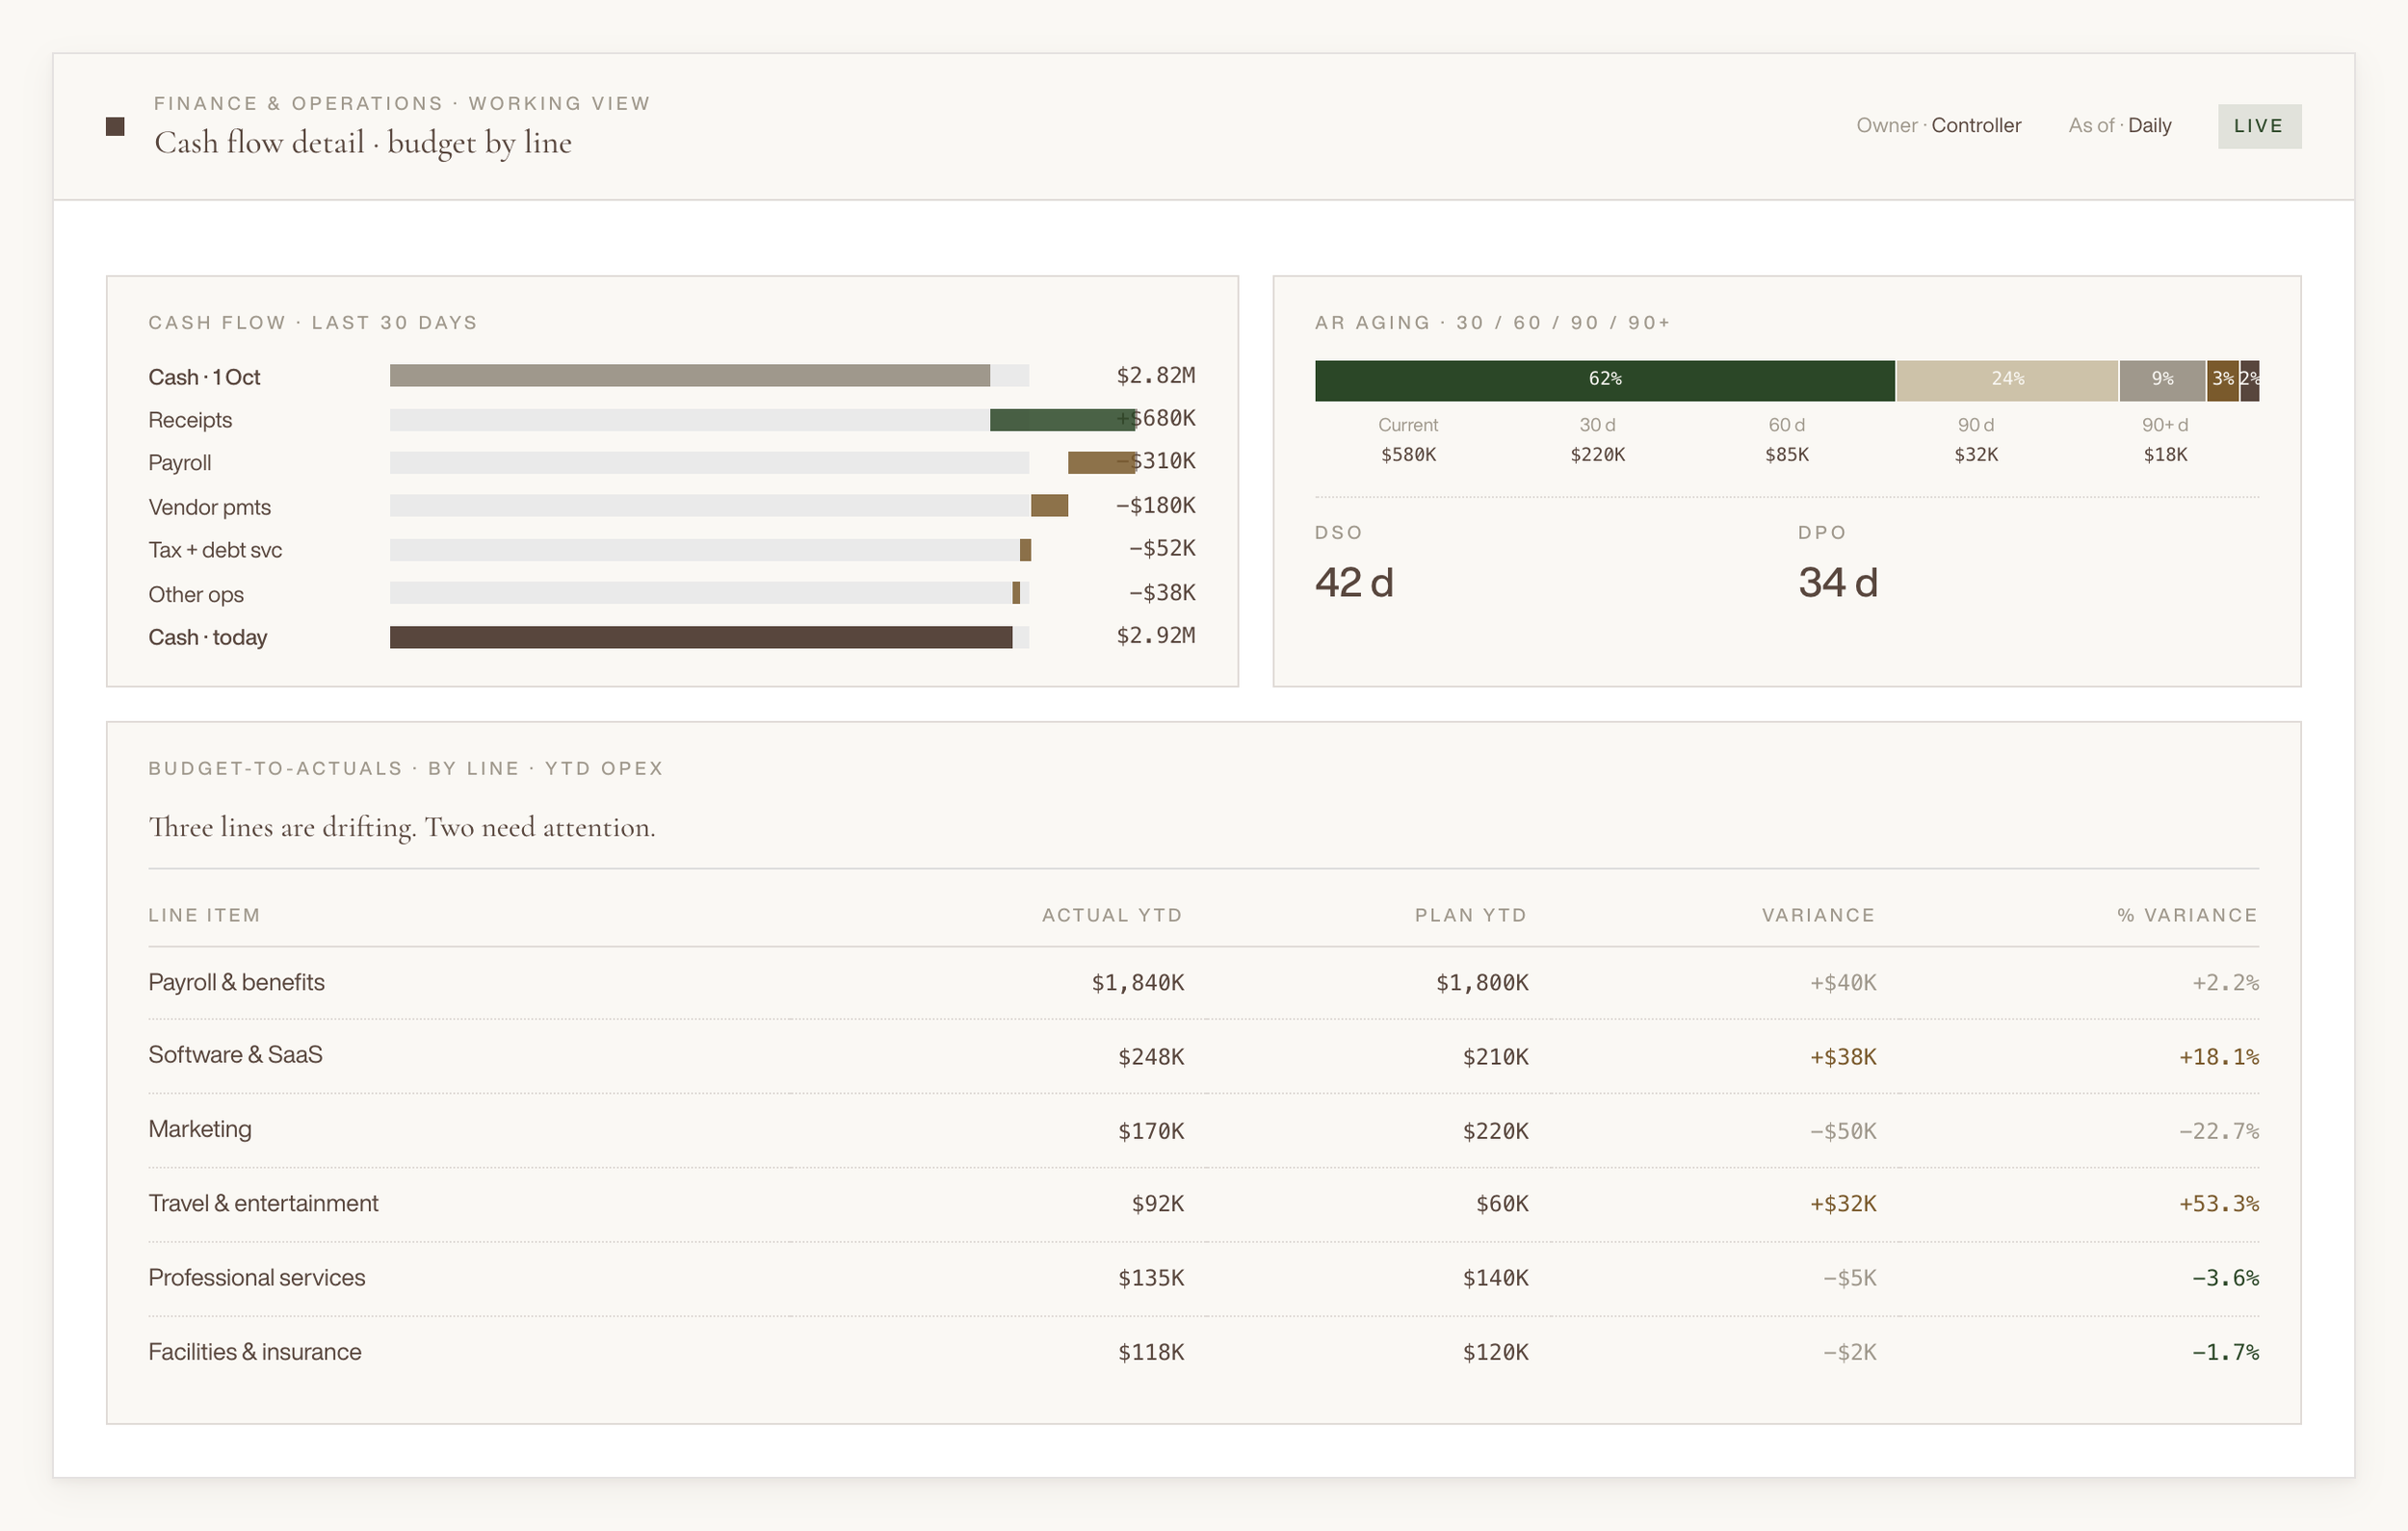
Business financial dashboard showing cash flow details, budget by line, and aging analysis with bar graphs and financial data.

built for your industry

Cash and budget are constant. The rest changes shape by sector.
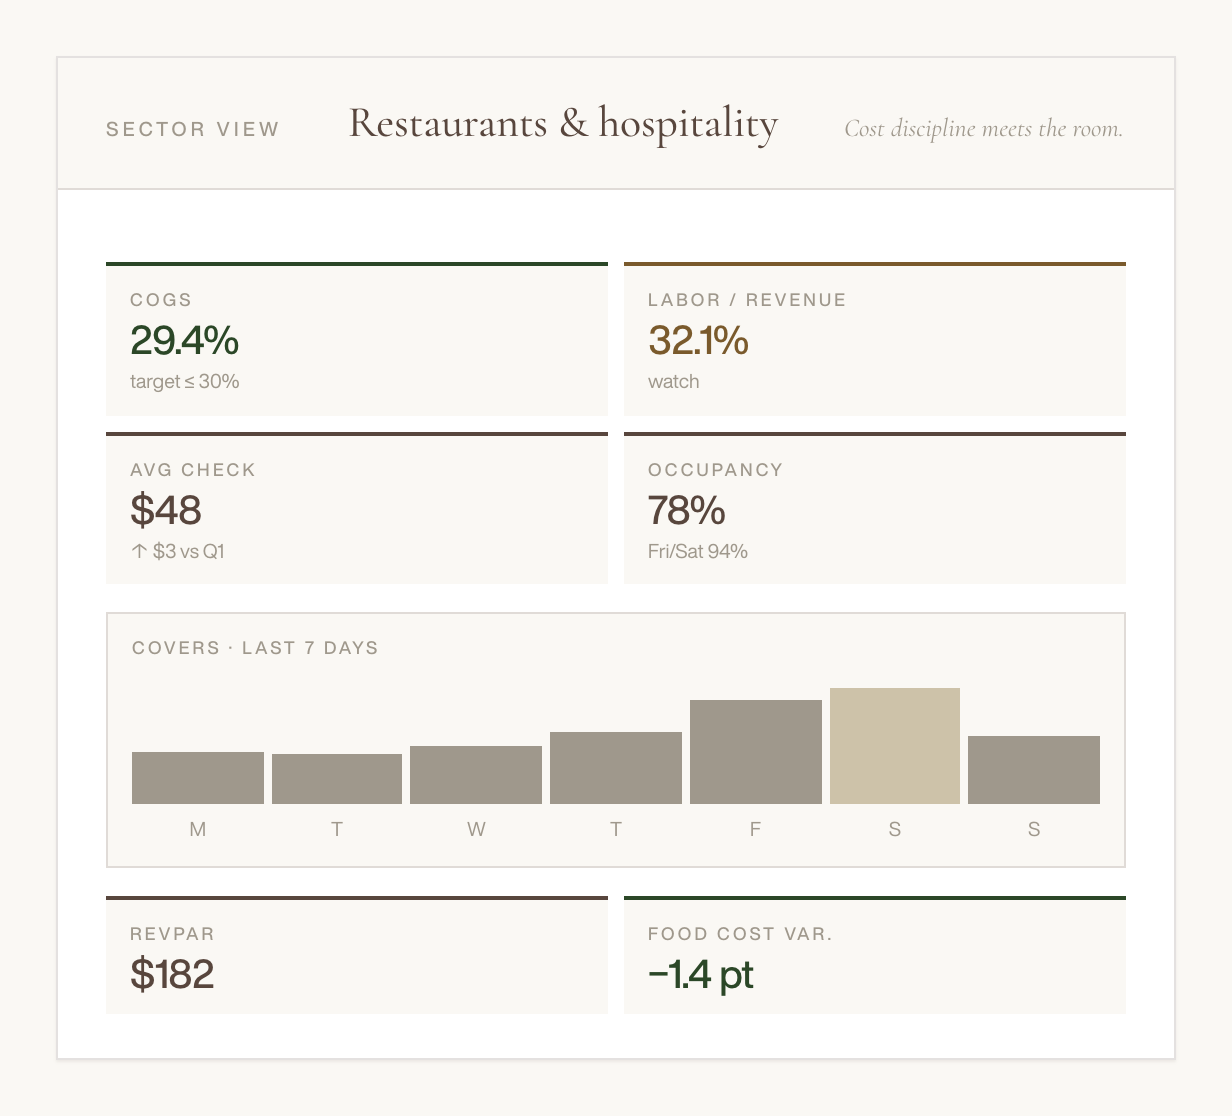
A restaurant and hospitality performance report showing key metrics such as COGS at 29.4%, Labor/Revenue at 32.1%, average check of $48, occupancy at 78%, covers over the last 7 days, revenue per available seat hour at $182, and food cost variance at -1.4 points. The report features a section header, subheadings, and bar chart with daily data.
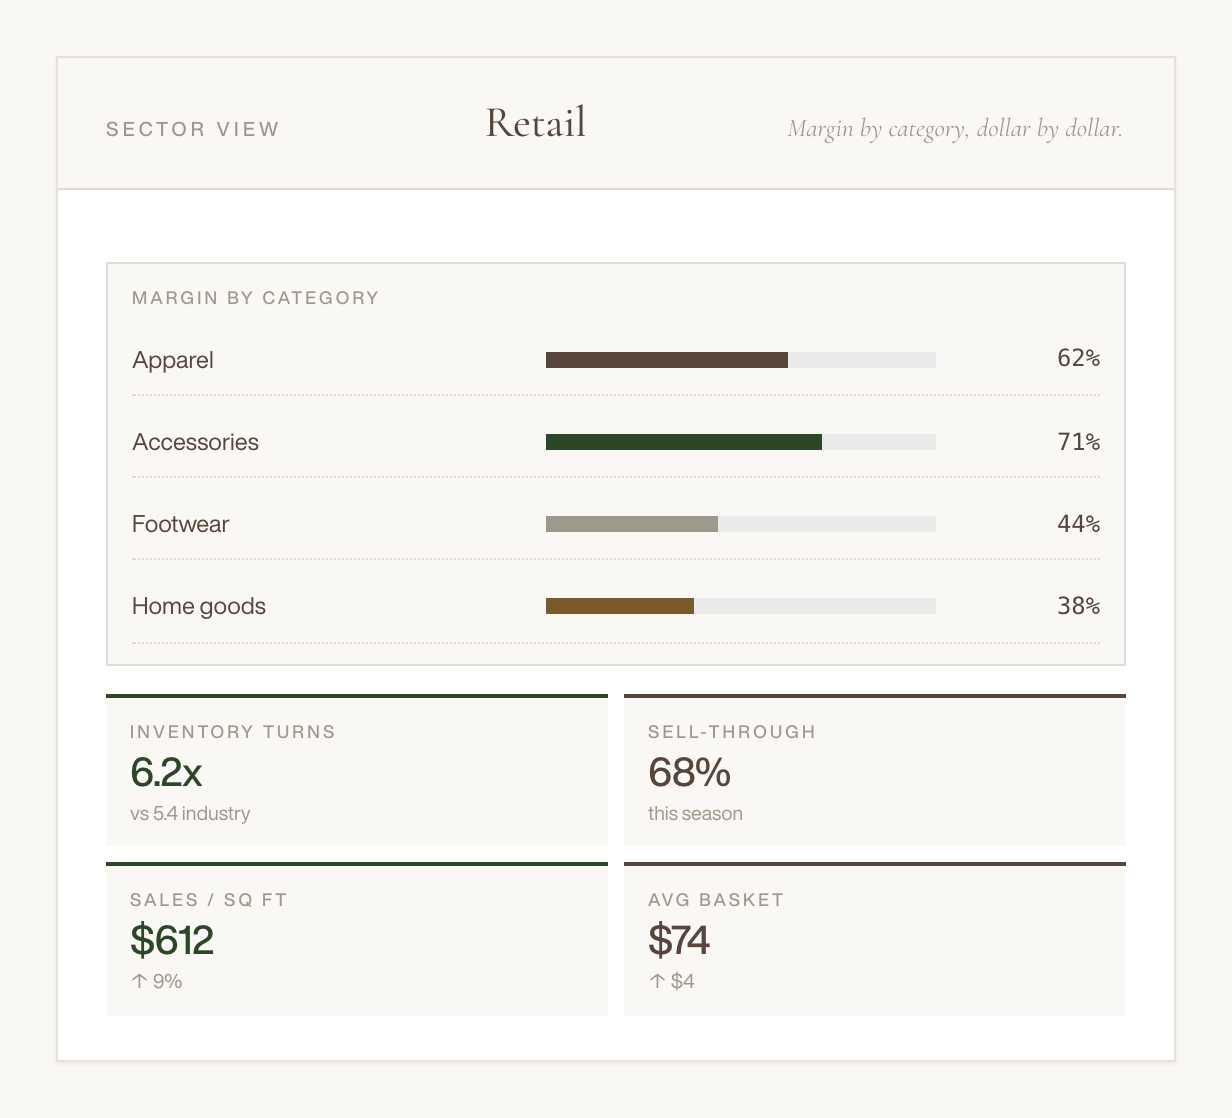
A retail sales report dashboard showing margins by category, inventory turns, sell-through percentage, sales per square foot, and average basket size, with categories like apparel, accessories, footwear, and home goods.

Your sector not here? No worries — we've built for plenty of others, and the discipline travels.

These are starting points, not templates. We build to what your business actually needs to watch.
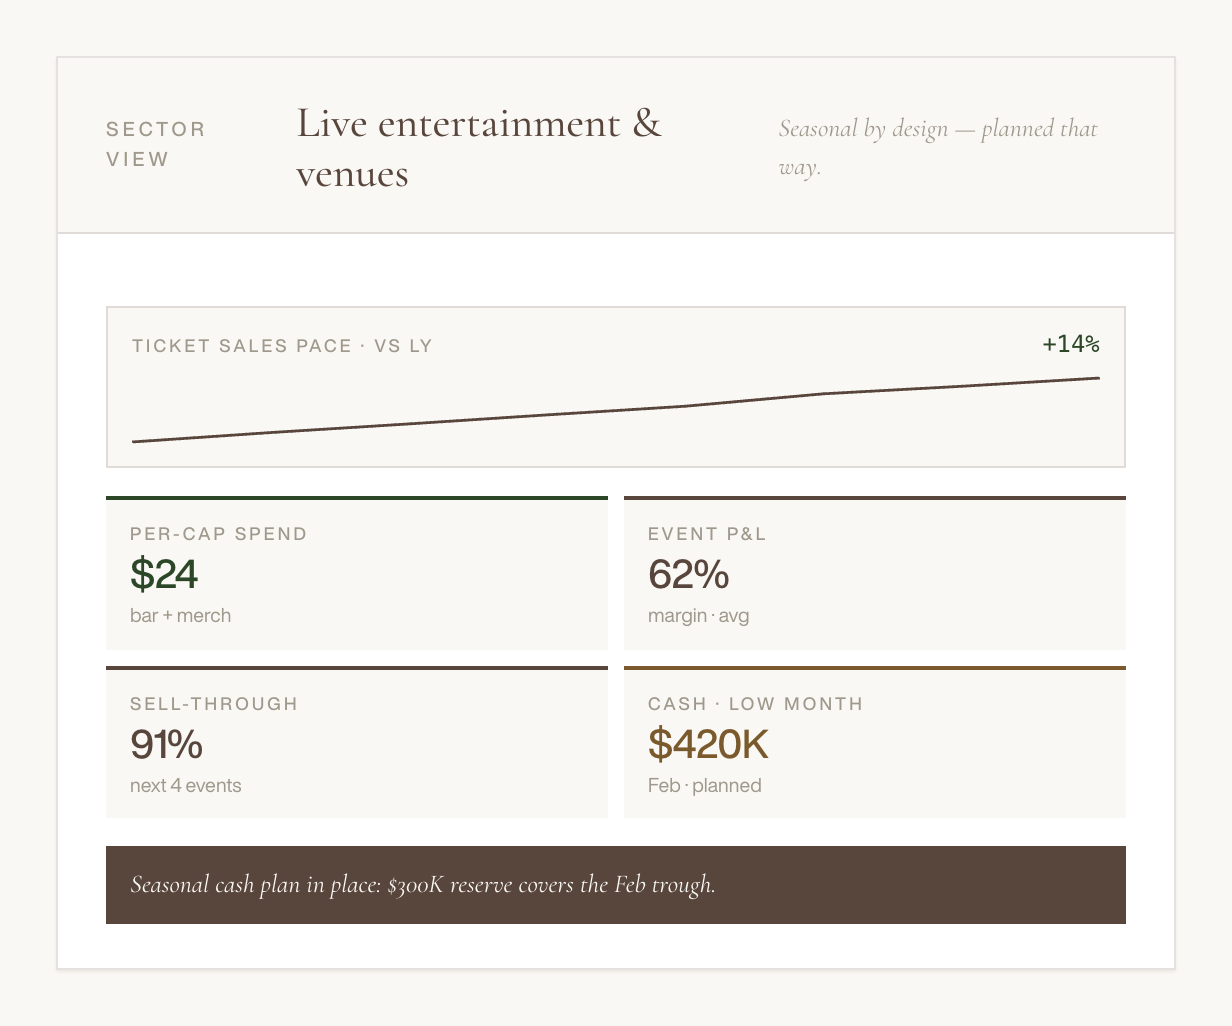
Business report slide titled 'Live entertainment & venues' with data on ticket sales, per-capita spend, event profit and loss, sell-through percentage, and cash plan for February, including a note on a $300K reserve.
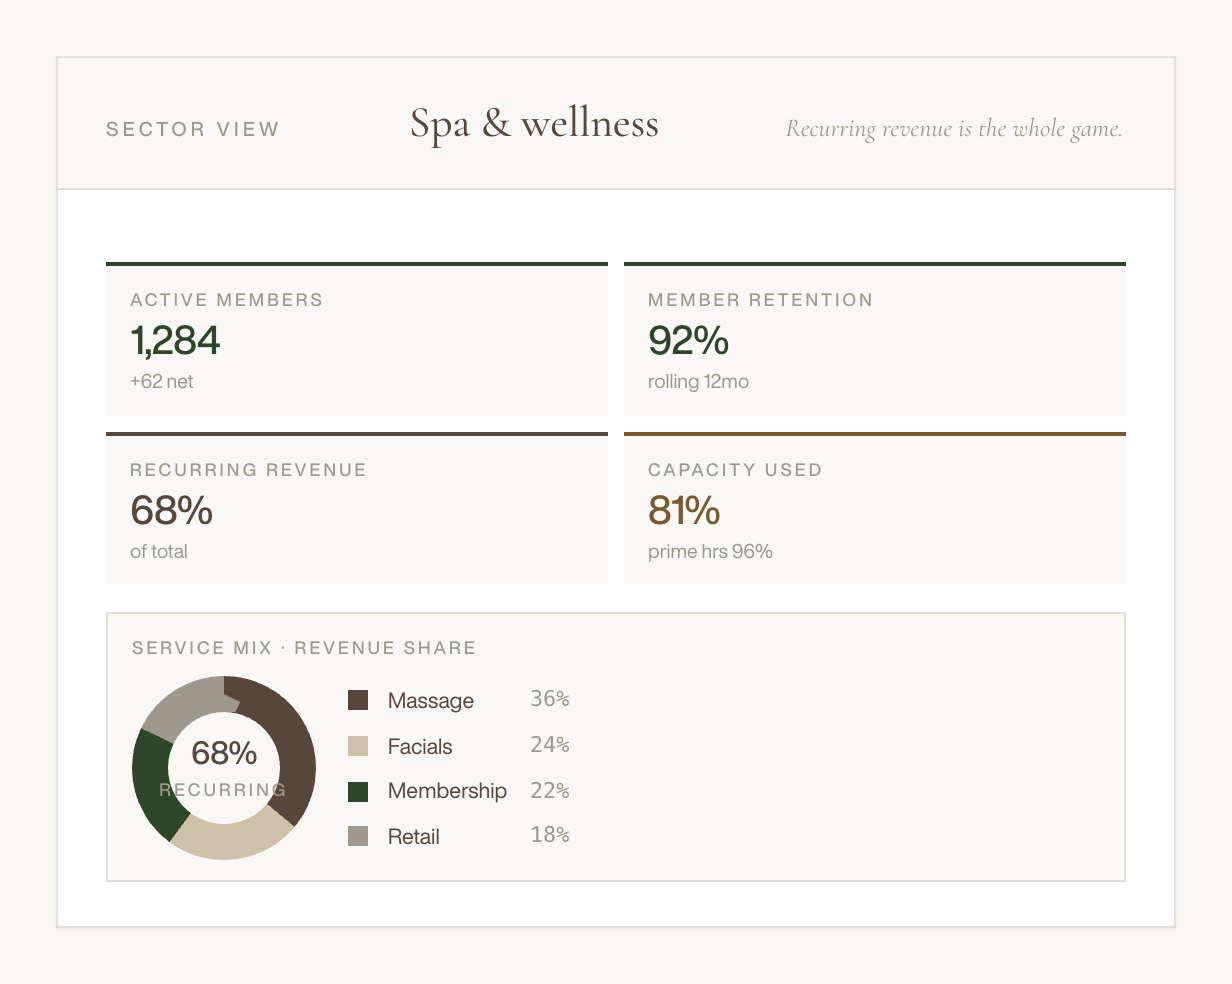
A digital dashboard displaying spa and wellness sector statistics, including active members, member retention, recurring revenue, capacity used, and service mix with revenue share percentages.
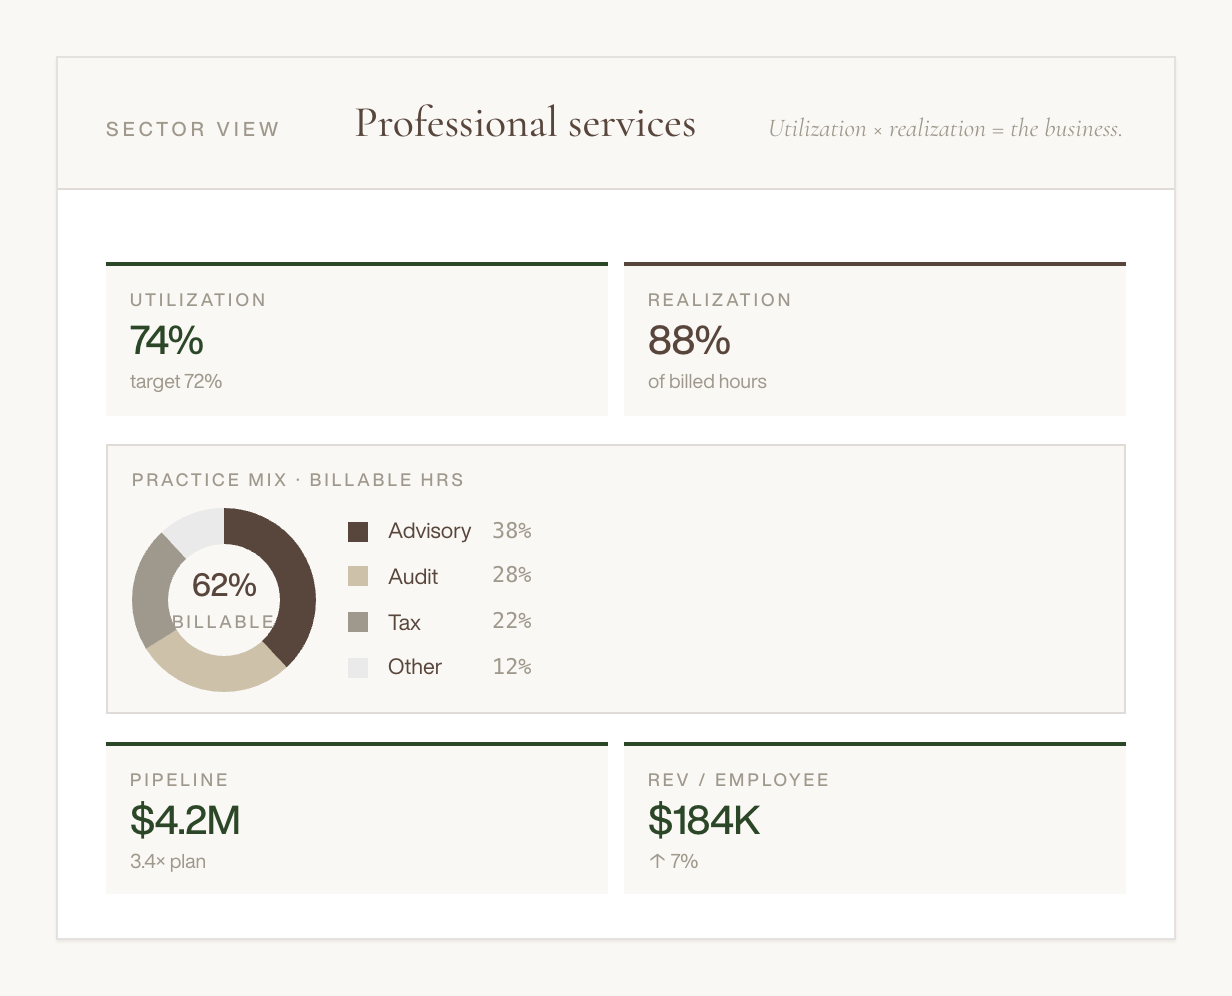
A business dashboard displaying professional services metrics including utilization at 74%, realization at 88%, a pie chart showing billable hours with advisory at 38%, audit at 28%, tax at 22%, and other at 12%. It also shows a pipeline value of 4.2 million dollars, and revenue per employee at 184 thousand dollars with a 7% increase.
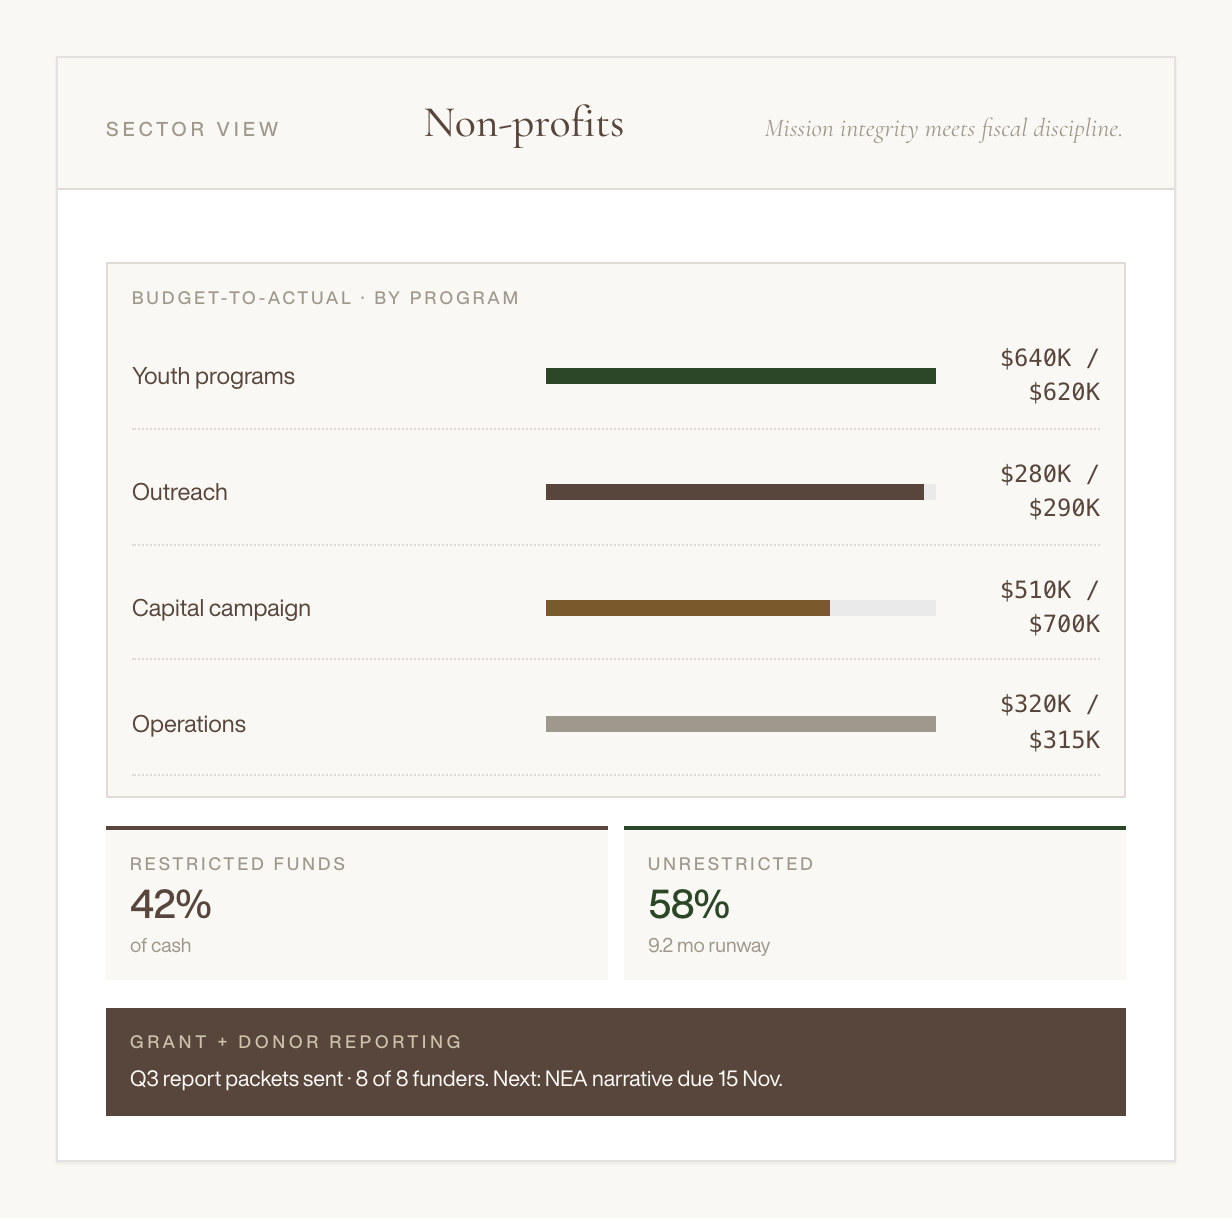
A report on non-profit funding showing budget-to-actual comparisons for various programs, including youth programs, outreach, capital campaigns, and operations, with percentage of restricted versus unrestricted funds and a note on grant and donor reporting.

two ways to engage

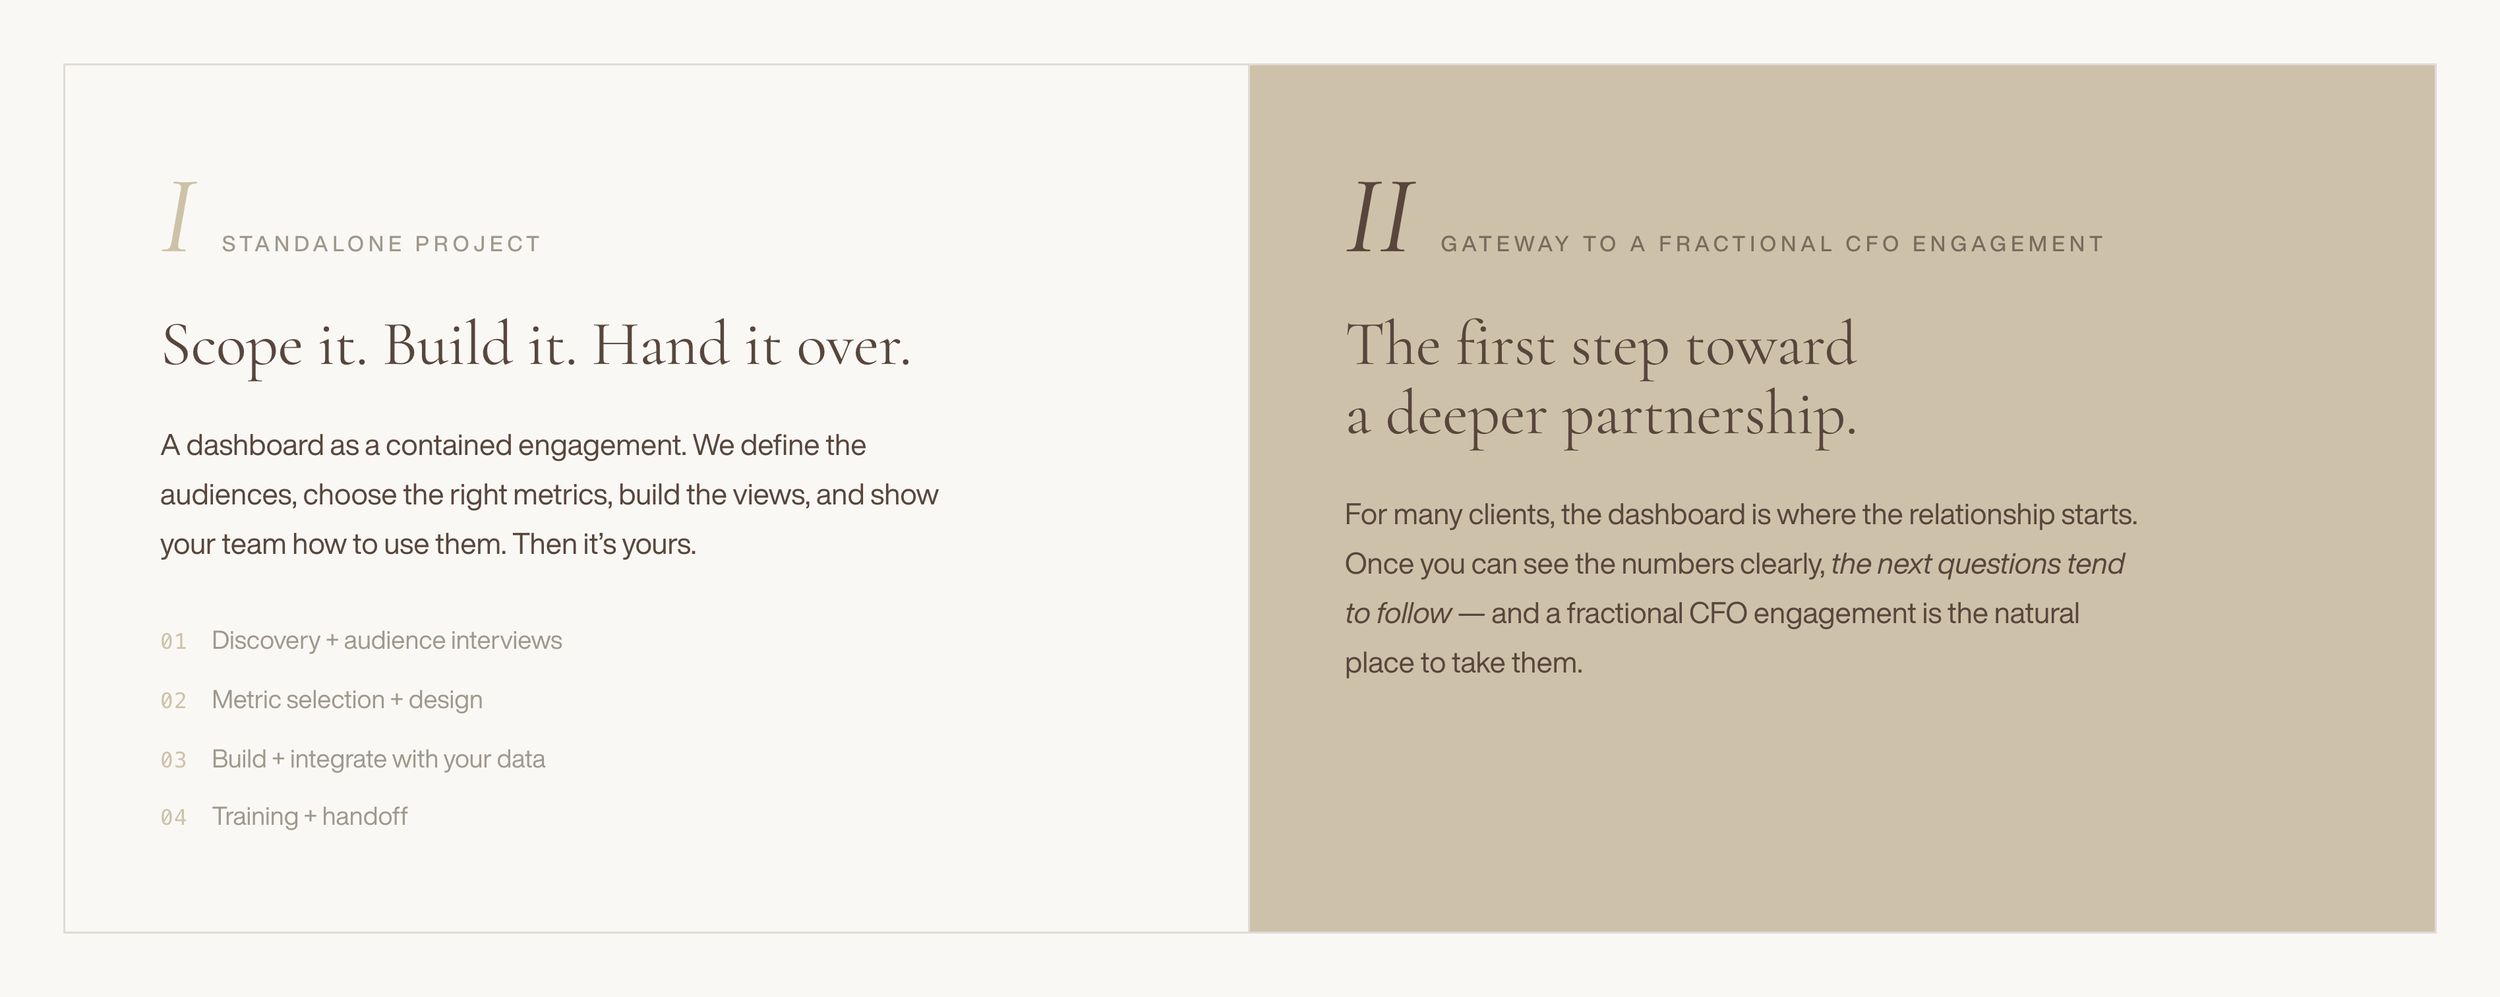
A two-page spread with beige and white backgrounds, featuring sections titled "Standalone Project" and "Gateway to a Fractional CFO Engagement," containing text about building and using dashboards for client engagement and partnership.

A one-time build. Or part of something bigger.

LET'S BUILD YOURS

Curious what a dashboard built for your business would look like?

Reach out and we'll walk you through options and pricing for dashboard creation — standalone, or as the on-ramp to a fractional CFO engagement.

Contact us about a dashboard.

Tell us about your business and what you are trying to measure. We’ll come back with scope, timeline, and a fixed quote within two business days.

START THE CONVERSATION

PAIR IT WITH

Two-hour Financial Literacy Workshop

Want your team to actually understand what these dashboards are showing? Ask about the workshop that teaches the numbers, in plain speak.

LEARN MORE ABOUT THIS INTERACTIVE WORKSHOP